


|
|
Section Summary Report

headingLTPP Section Summary Report feature provides data in both tabulated and graphical formats. In addition, this feature provides the ability to compare up to four sections side-by-side and up to 12 sections to export to Excel. Summary data can be displayed and downloaded in original (default) LTPP units, US Customary units, or the Metric system. LTPP has used multiple protocols and technologies to collect data during the life of the program. This is one possible explanation for data discontinuities or parallel trends for otherwise identical performance metrics. LTPP directives (available in the Operations tab) identify when methods change. The Library contains documentation on the actual protocols. Performance data is for the monitoring segment after completion of construction or acceptance into the LTPP program, whichever is latest. It is reported until the section is taken out-of-study from the program.
Section Summary Report
LTPP Section Summary Report feature provides data in both tabulated and graphical formats. In addition, this feature provides the ability to compare up to four sections side-by-side and up to 12 sections to export to Excel. Summary data can be displayed and downloaded in original (default) LTPP units, US Customary units, or the Metric system. LTPP has used multiple protocols and technologies to collect data during the life of the program. This is one possible explanation for data discontinuities or parallel trends for otherwise identical performance metrics. LTPP directives (available in the Operations tab) identify when methods change. The Library contains documentation on the actual protocols. Performance data is for the monitoring segment after completion of construction or acceptance into the LTPP program, whichever is latest. It is reported until the section is taken out-of-study from the program. Selected Section:State/Province:Section:Section Information:N/A N/A N/A N/A N/A N/A N/A N/A N/A
❮❮
❯❯
Recommended Citation:
Long Term Pavement Performance InfoPave, Section Summary Report, SDR 37, https://infopave.fhwa.dot.gov/Data/SectionSummaryReport
No Record Found
No Graph To Draw
|
||||||||||||||||||||||||||||||||||||||||||||||||||||||||||||||||||||||||||||||||||||||||||||||||||||||||||||||||||||||||||||||||||||||||||||||||||||||||||||||||||||||||||||||||||||||||||||||||||||||||||||||||||||||||||||||||||||||||||||||||||||||||||||||||||||||||||||||||||||||||||||||||||||||||||||||||||||||||||||||||||||||||||||||||||||||||||||||

LTPP InfoPave Section Summary Report
Welcome to LTPP InfoPave Section Summary Report, a convenient feature that provides an overview of each LTPP test section. With just a few clicks through this tour, you’ll be ready to quickly gain knowledge about the characteristics and performance of any LTPP test section. Ready?
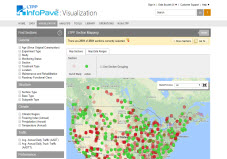
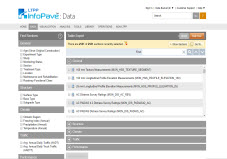
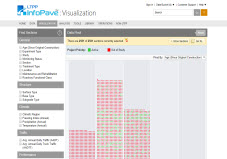
Find Sections
Under the "Find Sections" panel on the left hand side of your screen, there are a number of filters that can assist you in narrowing down your search for LTPP sections. These filters include general information, structure, climate, traffic, and performance filters.
If you point your mouse over each filter, you will see a description that explains how each filter works. For example, you can filter to find sections that are more than 25 years old using the Age filter.
Filter Menu
In the “Find Sections” panel bar, you will see different options under filter menu. If you filter your search criteria using “Find Sections,” you can save your filters by clicking on the “Save Filters” option in the “Filter Menu”. When you click on the “Save Filters” menu option, a new window will appear asking you to name your set of filters.
You can then open the saved filters by clicking on the “Open Filters” option in the “Filter Menu.” When you open a saved set of filters, InfoPave will automatically apply your saved filters.
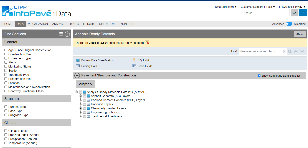
Section Information Bar
Section information bar shows the number of selected sections which have been filtered using the "Find Sections" panel. Other available options are "Show Sections" and "Go To…" The "Show Sections" button allows you to see the list of your selected sections and corresponding general information within each state or province.
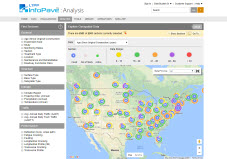
The "Go To…" feature provides quick access to and switching capability among a series of InfoPave features such as Maps, Section Summary Report, Section Timeline, Pavement Cross-Section Viewer, and others. For example, you can locate the sections on a map or visualize data to make sure you have selected the sections you had in mind.
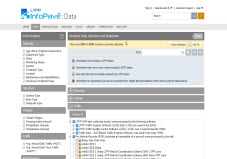
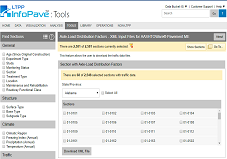
Unit System, Print, and Excel Export
Summary data can be displayed in original (default) LTPP units, US Customary units, or Metric system units.
Any information from the section summary report can be printed in a printer-friendly format by clicking on the printer icon. The information will be printed in the unit system that is currently selected.
The data and graphs included in the section summary report can also be downloaded in Microsoft Excel format by selecting "Export to Excel." Information for up to twenty five different sections can be downloaded in a single file. Data will be downloaded in the unit system that is currently selected.
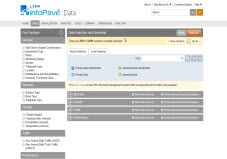
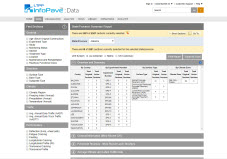
Data: Basic Section Overview
After narrowing down your search of test sections, you can review information about each section. The first tab, "Data", is open by default when navigating to the Section Summary Report, and the information in this tab is grouped into four different categories.
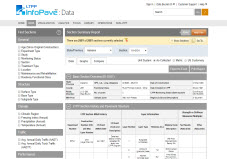
LTPP Section History and Pavement Structure
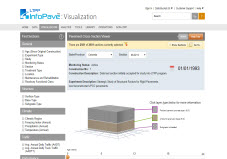
The second category, "LTPP Section History and Pavement Structure", contains information regarding Maintenance and Rehabilitation (M&R) and pavement structure layers. This information presented in this category can also be viewed visually by navigating to the "Section Timeline" or "Pavement Cross-Section Viewer" using the "Go To…" feature.
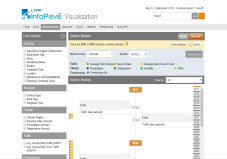
Climate and Traffic
The third category, "Climate and Traffic", includes a summary of the climate and traffic data collected by year since the section was incorporated into the LTPP program.
Performance
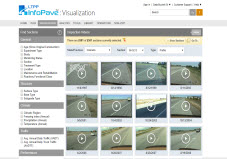
The final category, "Performance", summarizes the performance data collected since the section was incorporated into the LTPP program. This data includes distress data from Manual Distress Surveys (MDS), International Roughness Index (IRI) values from profile measurements, and deflection data from Falling Weight Deflectometer (FWD) testing.
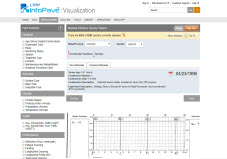
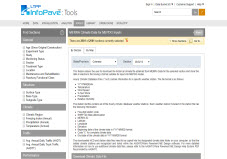
Graphs
By clicking on the "Graphs" tab of the Section Summary Report feature, you can see a graphical representation of several of the data summaries included in the "Data" tab. For example, by selecting the "Average Annual Precipitation" category, you can view a graph of precipitation vs. year for the currently selected section.
If you select a different unit system, the graphs will automatically update using the new unit system selection.
Compare
The Section Summary Report gives you the capability to compare data from up to four different test sections. In order to compare data from different sections, first select the "Compare" tab. Next, click the first "Select" button under "Select Sections" and chose a section to use for comparison. Use the "select" button in the next two columns as necessary to add the third or fourth test sections to the comparison.
You can now view a side-by-side comparison of descriptive and performance data for each of the selected sections. There are two additional sub-tabs included in the "Compare" tab. The first sub-tab, "Data", presents comparisons in tabular form, and the second sub-tab, "Graphs", presents comparisons in graphical form.
The attributes used for comparison can be customized by clicking "Select Attributes".
